Alerts
EnterpriseSend alerts to the NetStacks Controller over HTTP, de-duplicate and route them with pipeline rules, let AI agents triage them, escalate through email, Slack, PagerDuty or webhooks, and work alerts from the Terminal.
Overview
The Alert Ingestion & Pipeline plugin (alerts) gives the Controller an alert inbox. Your monitoring tools send alerts to it over HTTP. NetStacks de-duplicates repeats, applies your pipeline rules, and hands alerts to AI agents that investigate them, record a root cause and can resolve or escalate them. Alerts that stay open too long are escalated to email, Slack, PagerDuty or a webhook.
You work alerts in the Terminal (the bell icon). The admin console shows read-only alert and rule tables.
How an Alert Flows
- Ingest. A monitoring system POSTs the alert to the webhook endpoint. NetStacks maps its severity to
critical,warningorinfo. - De-duplicate. If the same alert (same source and summary) is still open or acknowledged and was last seen within 5 minutes, NetStacks increases its occurrence count instead of creating a new alert.
- Route. New alerts are checked against your pipeline rules in priority order. The first matching rule decides what happens: send to a specific AI agent, handle it with a fast path (acknowledge, re-label, suppress, tag), or suppress it.
- Triage. Alerts not suppressed or fast-pathed go to an AI agent. The agent investigates and records its verdict (root cause, impact, resolution) and an investigation timeline on the alert.
- Incident. When triage completes, the Incidents plugin checks its creation rules and can open an incident linked to the alert.
- Escalate. Escalation policies notify a channel when an alert of a given severity stays open longer than the time you set.
Work Alerts in the Terminal
In the Terminal connected to the Controller, click the bell icon (Alerts) in the left activity bar. The panel lists alerts newest first and refreshes every 15 seconds (the Live indicator). Use the refresh button to reload immediately, and the filter chips at the top to narrow the list by state (for example Acknowledged or Resolved).
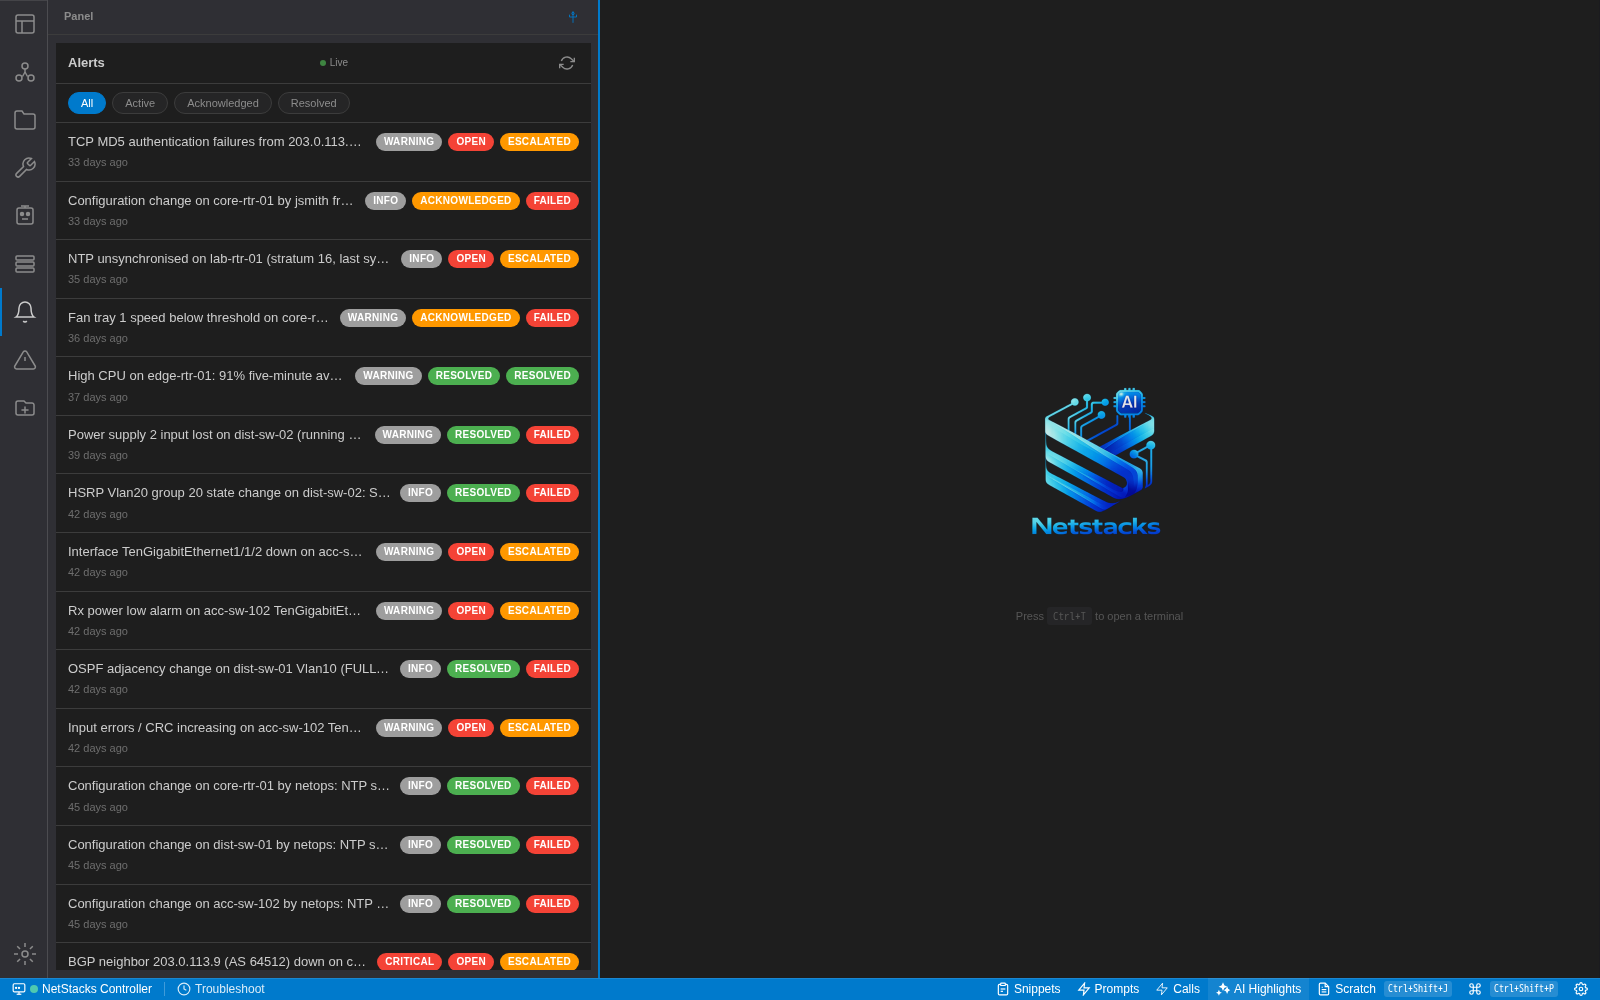
Each row shows three badges:
- Severity — CRITICAL, WARNING or INFO.
- State — OPEN, ACKNOWLEDGED, RESOLVED or SUPPRESSED.
- Triage state — where the AI investigation stands, for example TRIAGING, TRIAGED, RESOLVED (resolved by the agent), ESCALATED, PENDING_REVIEW (the agent asked for a human), SKIPPED (suppressed or fast-pathed by a rule) or FAILED.
Alert Details
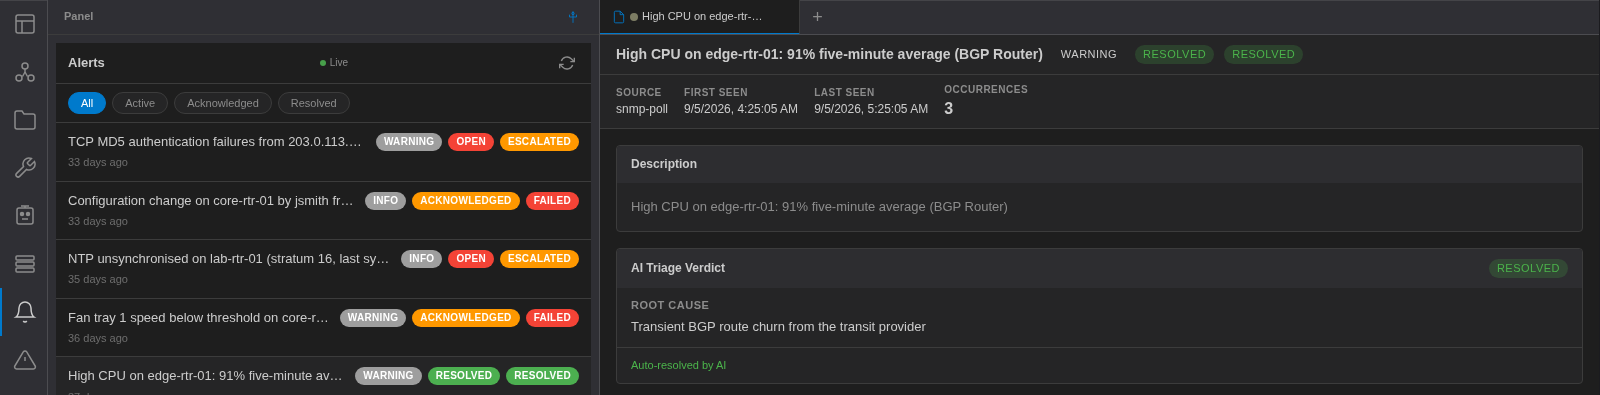
Click an alert to open it in a tab. The header shows the summary and badges, then Source, First Seen, Last Seen and Occurrences. Below are these sections:
- Description
- AI Triage Verdict — the agent's Root Cause, Impact and Resolution, with an Auto-resolved by AI or Incident linked badge when applicable.
- Investigation Timeline — every step: alert ingested, routing decision, agent started, tool calls and results, observations, correlations, decisions, escalation and resolution. Use Show details on an entry to see its data.
- Details & Metadata — Device ID, Fingerprint, Triage Agent, Correlated With and Incident.
- Raw Payload — the alert's details as received, with a Copy button.
Resolve or Suppress
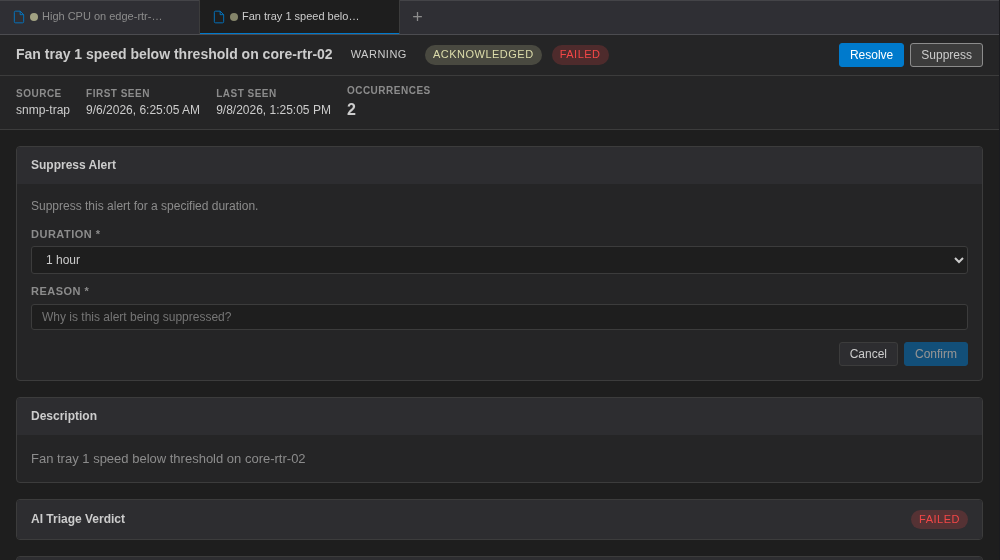
Acknowledged alerts show Resolve and Suppress buttons in the tab header:
- Resolve opens the Resolve Alert panel. Click Confirm to mark the alert resolved.
- Suppress opens the Suppress Alert panel. Pick a Duration (15 min, 30 min, 1 hour, 2 hours, 4 hours, 8 hours or 24 hours), enter a Reason and click Confirm. The alert is suppressed until that time.
AI agents can also resolve alerts during triage, and pipeline rules can acknowledge or suppress them automatically.
Admin Console Views
In the admin console, the sidebar's Plugins section has two read-only tables for this plugin. They refresh automatically.
- Alerts (
/plugin/alerts/alert-list) — Severity, Source, Summary, State, Device and Created. - Pipeline Rules (
/plugin/alerts/pipeline-rules) — Name, Priority, Enabled and Matches (how many alerts each rule has matched).
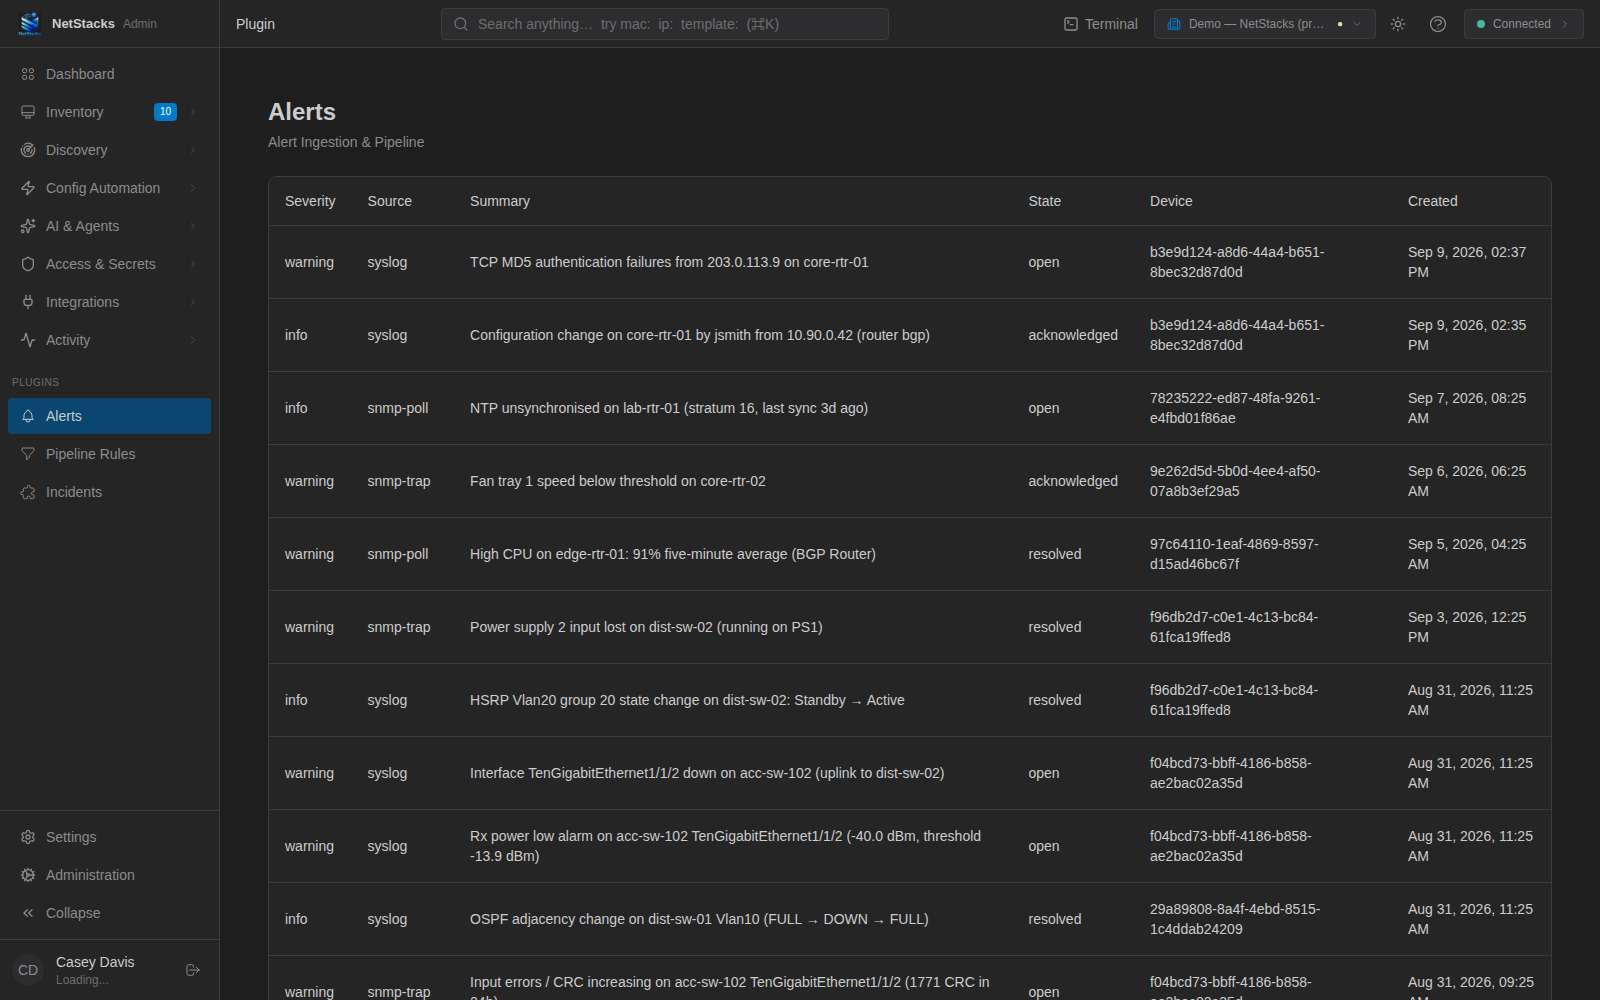
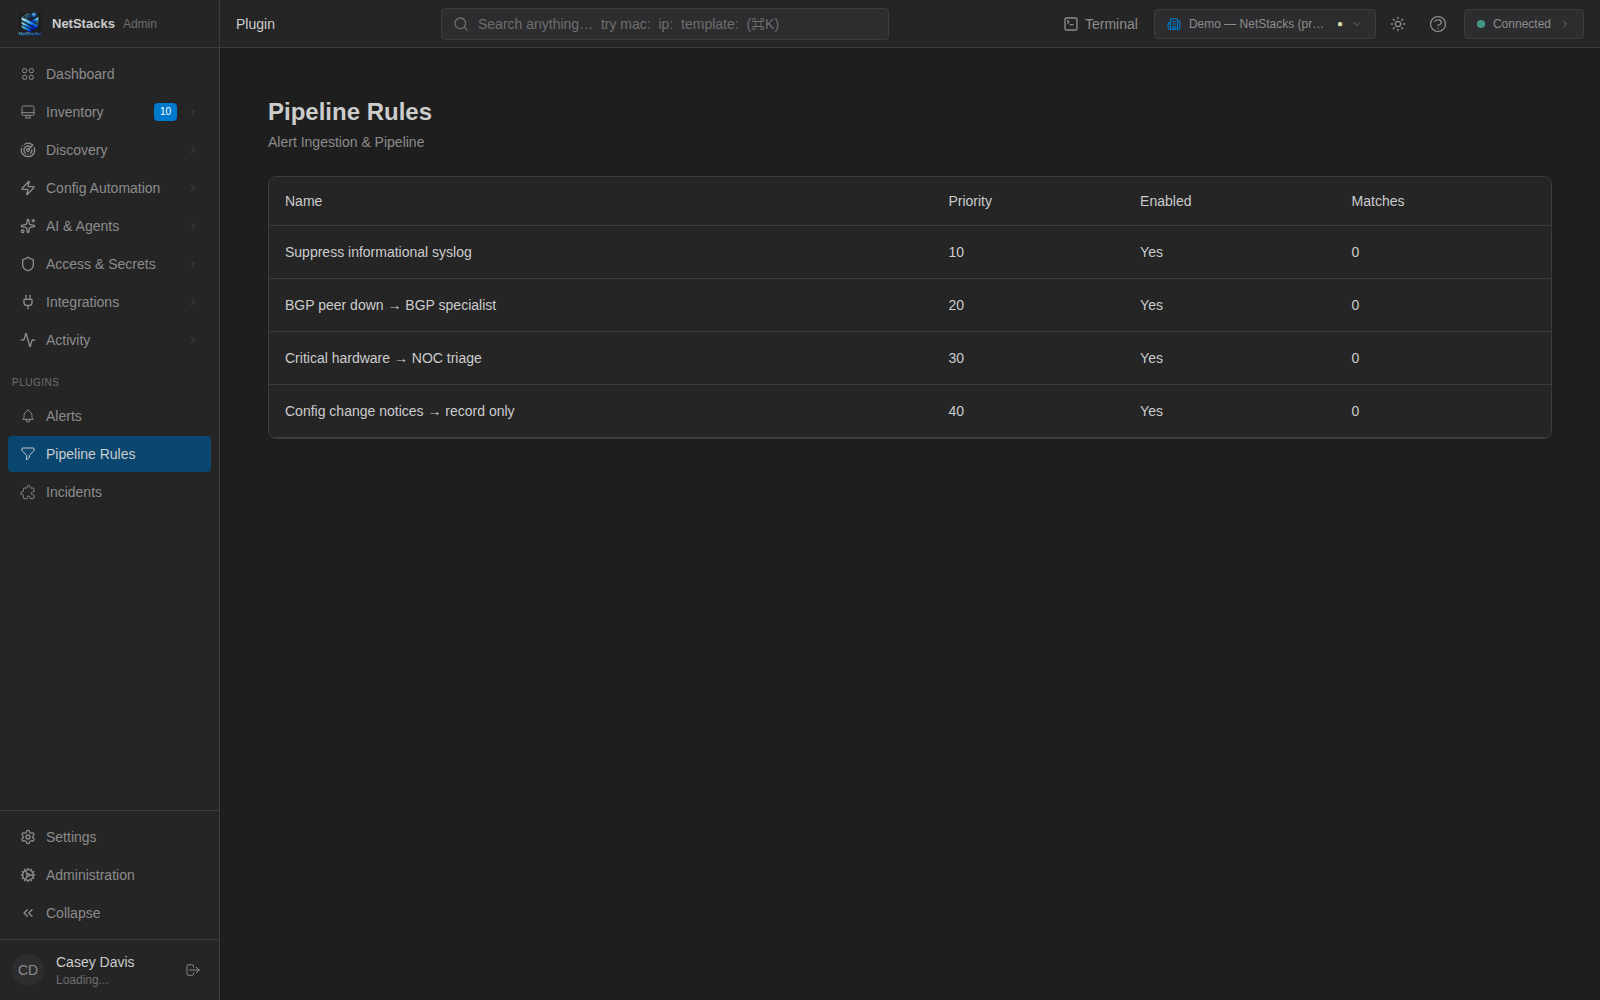
To change alerts, use the Terminal. To create or edit pipeline rules, severity mappings, notification channels and escalation policies, use the plugin's API as described below.
Send Alerts to NetStacks
Send each alert as a JSON POST to the webhook endpoint, authenticated with a NetStacks access token (see API Authentication). The alert is stored in the organization of the token's user.
curl -X POST https://<controller>/api/plugins/alerts/ingest/webhook \
  -H "Authorization: Bearer $NETSTACKS_TOKEN" \
  -H "Content-Type: application/json" \
  -d '{
    "source": "librenms",
    "severity": "critical",
    "summary": "BGP neighbor 203.0.113.9 down on core-rtr-01",
    "device_id": "b3e9d124-a8d6-44a4-b651-8bec32d87d0d",
    "details": { "interface": "Te0/0/1", "peer_as": 64512 }
}'| Field | Required | Description |
|---|---|---|
source | yes | Where the alert came from (any string, such as librenms, syslog, snmp-trap). Used for de-duplication, severity mapping and rules. |
summary | yes | One-line description. Used for de-duplication and rules. |
severity | no | The source's own severity string. Mapped as described in Severity Mapping. Missing → info. |
device_id | no | The device's ID in the Controller inventory. Include it so agents and incidents know which device is affected. |
details | no | Any JSON object. Shown as the Raw Payload and usable in rules as details.<path>. |
The endpoint returns 201 with the stored alert (or the existing alert, if this one was a duplicate). If your monitoring tool sends its own payload format (for example Prometheus Alertmanager), put a small relay in front that converts each alert into the fields above.
Severity Mapping
Alerts have three severities: critical, warning and info. The incoming severity is mapped in this order:
- A severity mapping you defined for that
sourceand source severity. - Otherwise by keyword: contains critical, emergency, alert, fatal or severe →
critical; contains warning, warn, error or major →warning; anything else →info.
Add a mapping with POST /api/plugins/alerts/admin/severity-mappings:
{ "source": "librenms", "source_severity": "minor", "mapped_severity": "warning" }Deduplication
NetStacks fingerprints each alert from its organization, source and summary. If an alert with the same fingerprint is open or acknowledged and was last seen less than 5 minutes ago, the new alert is folded into it: the Occurrences count goes up and Last Seen is updated. Duplicates don't run the pipeline again.
details are not part of the fingerprint, put values that change on every event (counters, timestamps) in details, not in summary, so repeats de-duplicate.Pipeline Rules
Pipeline rules decide what happens to each new alert. Enabled rules are checked in priority order (lowest number first) and the first matching rule wins. If no rule matches, the alert goes to AI triage with the default agents (see AI Triage).
Conditions
A rule has a list of conditions, and all of them must match. A rule with no conditions matches every alert. Each condition is {field, operator, value}:
field— an alert field such asseverity,source,summaryordevice_id, ordetails.<path>for a value inside the details (dot-separated for nested values).operator—eq,neq,contains,not_contains,regex,gt,lt,in,not_in(in/not_intake a list).
Actions
| Action | Effect |
|---|---|
route_to_agent (default) | Sends the alert to the AI agent in agent_id. The agent must be enabled and have auto-triage turned on. |
fast_path | Handles the alert without AI using fast_path_config: auto_acknowledge (true/false), set_severity, suppress_minutes, add_tags (object of tag → value). |
suppress | Marks the alert suppressed with no triage. |
Create a rule
POST /api/plugins/alerts/admin/routing-rules (edit with PUT and remove with DELETE on /admin/routing-rules/<id>):
{
  "name": "BGP peer down → BGP specialist",
  "priority": 20,
  "enabled": true,
  "conditions": [
    { "field": "summary", "operator": "regex", "value": "BGP (neighbor|peer) .* down" },
    { "field": "severity", "operator": "in", "value": ["critical", "warning"] }
  ],
  "action": "route_to_agent",
  "agent_id": "<agent UUID>"
}
A suppress-noise example:
{
  "name": "Suppress informational syslog",
  "priority": 10,
  "conditions": [
    { "field": "source", "operator": "eq", "value": "syslog" },
    { "field": "severity", "operator": "eq", "value": "info" }
  ],
  "action": "suppress"
}
Each match increases the rule's Matches count shown on the Pipeline Rules page.
AI Triage
AI triage uses the Controller's AI agents. To make an agent available for alerts, open it under AI & Agents and turn on Auto-triage matching alerts (see AI Agents).
- A
route_to_agentrule sends the alert to the agent it names. - When no rule matches, the alert goes to every enabled agent with auto-triage turned on whose alert patterns match (an agent without patterns takes all alerts).
The Controller gives the agent the alert plus context from the knowledge base and the device inventory. During triage the agent can use alert tools to:
- record findings on the alert — tags, root cause and impact;
- correlate the alert with related alerts;
- resolve the alert with a resolution note;
- escalate it;
- request a human review.
Everything the agent does is written to the alert's Investigation Timeline. When the run completes, the triage state becomes TRIAGED (or whatever the agent set, such as RESOLVED or ESCALATED) and the incident creation rules are evaluated.
Notifications and Escalation
Notifications are sent by escalation policies. Every minute, each enabled policy looks for alerts that have the policy's severity, are still open, are older than escalate_after_mins, and haven't been resolved, escalated or skipped. Each such alert is marked ESCALATED, the escalation is added to its timeline, and a message is sent to the policy's channel. Each alert is escalated once.
1. Create a notification channel
POST /api/plugins/alerts/admin/pipeline/channels with {name, channel_type, config}:
channel_type | config keys |
|---|---|
slack | webhook_url (Slack incoming webhook) |
pagerduty | routing_key (Events API v2 integration key) |
email | smtp_host, smtp_port (default 587), from_address, to_addresses (list), tls (default true), username, password |
webhook | url, optional headers |
{ "name": "NOC Slack", "channel_type": "slack", "config": { "webhook_url": "https://hooks.slack.com/services/..." } }2. Create an escalation policy
POST /api/plugins/alerts/admin/escalation-policies with the channel's id:
{ "name": "Critical — Slack after 15 minutes", "severity": "critical", "escalate_after_mins": 15, "channel_id": "<channel id>", "enabled": true }Create one policy per severity you want to escalate. Alerts that are acknowledged or resolved before the time is up are not escalated.
Alerts API Reference
All paths are under /api/plugins/alerts and need a NetStacks access token. Results are scoped to your current organization.
| Endpoint | Purpose |
|---|---|
POST /ingest/webhook | Send an alert. |
GET /admin/alerts | List alerts, newest first (up to 1000). Filters: state, severity, source, device_id, triage_state. |
GET /admin/alerts/stats | Counts by state, severity, triage state, and top sources. |
GET / PUT /admin/alerts/<id> | Read an alert, or change state (open, acknowledged, resolved, suppressed), acknowledged_by, suppressed_until. |
GET /admin/alerts/<id>/correlations | Alerts correlated with this one. |
GET /admin/triage-events/<alert_id> | The alert's investigation timeline. |
/admin/routing-rules | Pipeline rules: GET, POST; and GET/PUT/DELETE on /<id>. |
/admin/severity-mappings | GET, POST; DELETE on /<id>. |
/admin/pipeline/channels | Notification channels: GET, POST; GET/PUT/DELETE on /<id>. |
/admin/escalation-policies | GET, POST; PUT/DELETE on /<id>. |
GET /admin/analytics/agent-performance?days=7 | Triage agent performance over 1–90 days. |
Related Pages
- Incidents & ITSM
- AI Agents — set up triage agents.
- Knowledge Base — context agents use during triage.
- Plugin System
- API Authentication