Network Topology
Build, discover and explore network diagrams in the Terminal's 2D and 3D topology views, share them through the Controller, and map devices from discovery data.
Video Walkthrough
From the session library to the map — organising devices, then building and enriching the topology those sessions describe, in 2D and 3D.
Overview
Topologies are drawn and explored in the Terminal (desktop app or browser terminal). A topology is a saved diagram of devices, links between them (with interface names and labels) and annotations. You can build one by discovery, from a traceroute, by importing JSON, or by drawing it by hand.
- Standalone: topologies are saved in the Terminal's local database.
- Enterprise: topologies are saved on the Controller; you can publish them to your team, and administrators can review them in the admin console.
The Topology Sidebar
Click Network Topology in the activity bar (the icon of three connected circles). The sidebar toolbar has New Topology, Import topology JSON, Paste Traceroute / MTR, New Folder, Refresh and a sort toggle, above Search topologies... and the list of saved topologies.
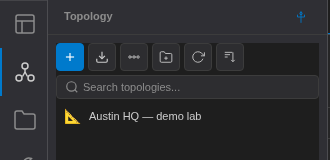
Double-click a topology to open it in a tab. Right-click for Rename and Delete, and in enterprise mode Publish to Team / Unpublish. Published topologies appear under Team Topologies for everyone in the organization.
Creating a Topology
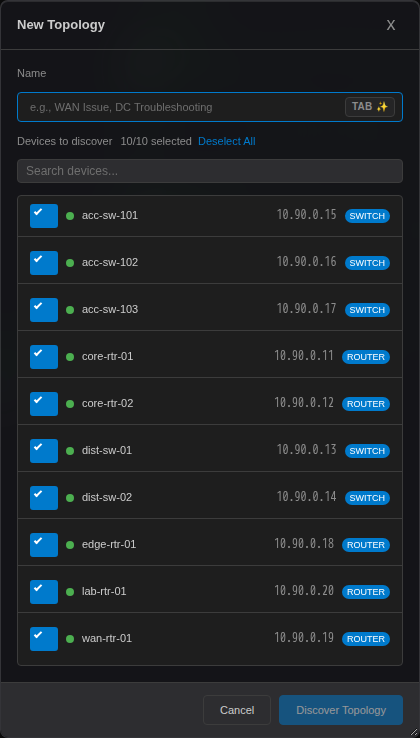
- Discover — New Topology, enter a name, pick the devices (standalone: your open terminal sessions; enterprise: Controller devices) and click Discover Topology. NetStacks finds LLDP/CDP neighbours and draws the links. See Network Discovery.
- From a traceroute — see Visualize a Traceroute.
- Import — Import topology JSON loads a file exported with Export as JSON.
- Draw — create an empty topology and place devices with the Device (D) tool.
Working on the Canvas
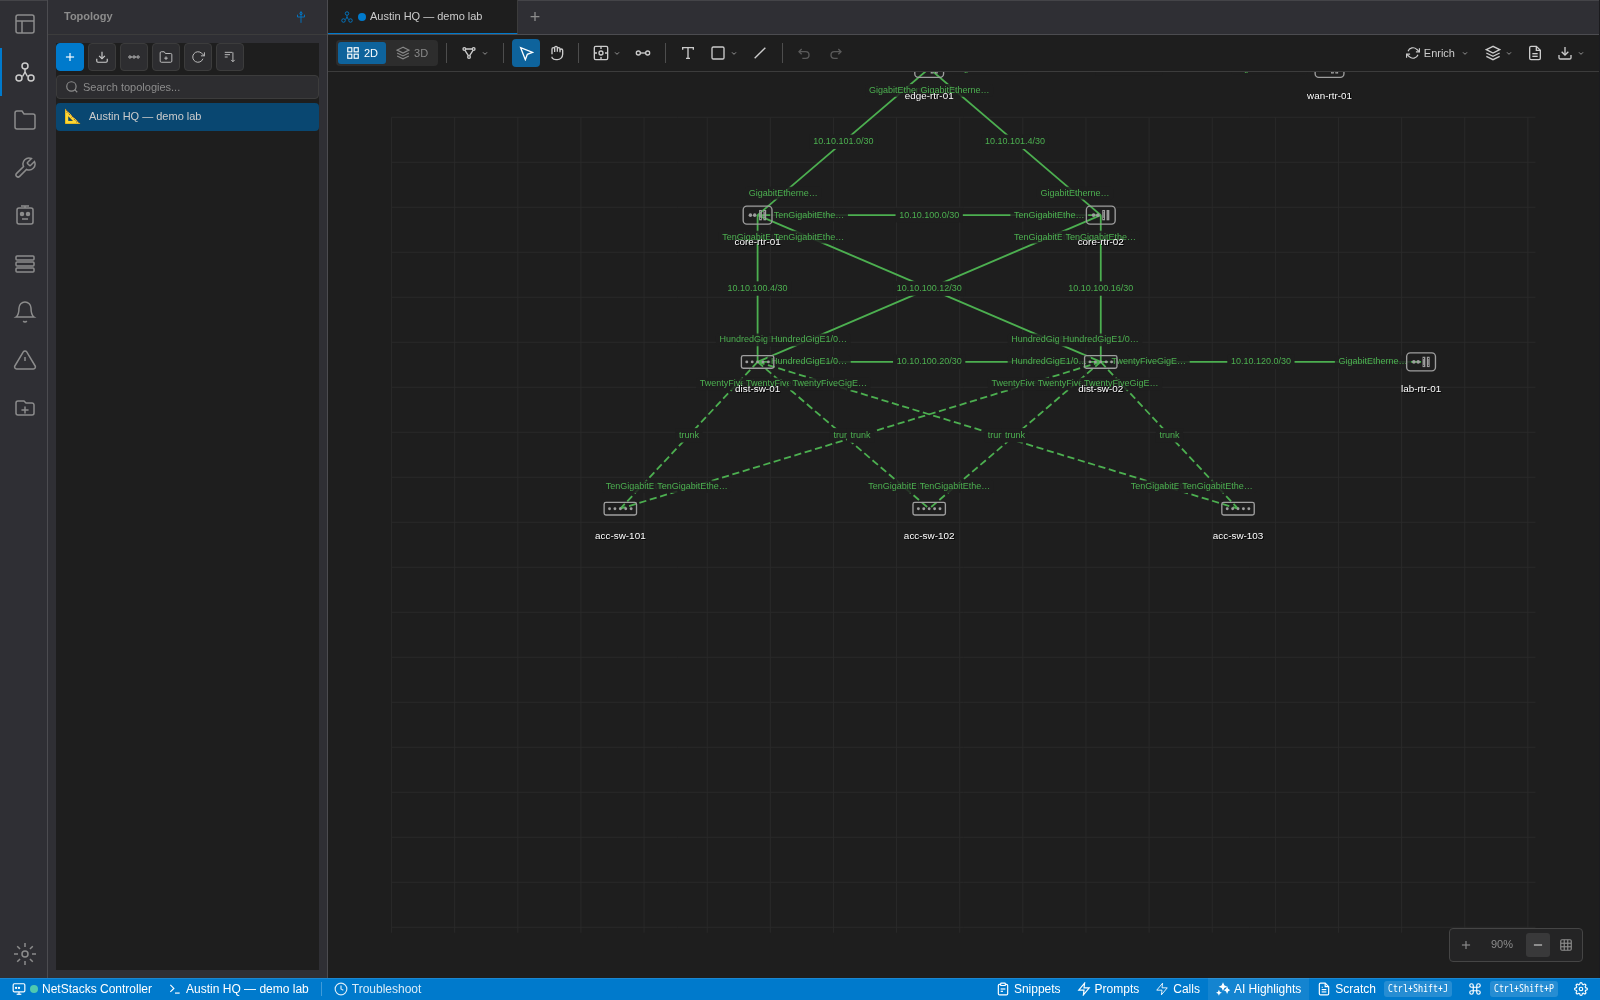
The 2D canvas supports zooming (25% to 400%) with the controls at the bottom right (Zoom in, Zoom out, Reset view) or the mouse wheel, panning, and dragging devices to new positions. Links show the interface names at each end and an optional label such as the subnet.
Toolbar Reference
| Control | What it does |
|---|---|
| 2D / 3D | Switch between the 2D canvas and the 3D view. |
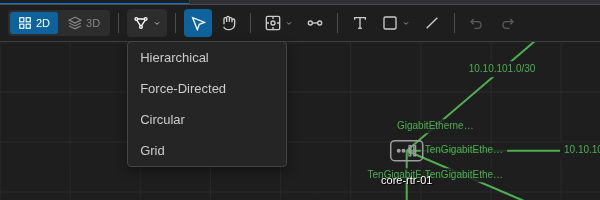
| Auto-layout | Re-arrange devices: Hierarchical, Force-Directed, Circular or Grid. |
| Select (V), Pan (H) | Select and move items, or pan the canvas. |
| Device (D) | Place a device. Types: Router, Switch, Firewall, Server, Cloud, Access Point, Load Balancer, WAN Optimizer, Voice Gateway, Wireless Controller, Storage, Virtual, SD-WAN, IoT, Unknown. |
| Connect (C) | Draw a link between two devices. |
| Text (T), Shape (S), Line (L) | Annotations. Shapes: rectangle, circle, diamond, arrow, cloud. |
| Undo / Redo | Cmd/Ctrl+Z / Cmd/Ctrl+Shift+Z |
| Enrich | Look up extra data for devices (see Enrich). |
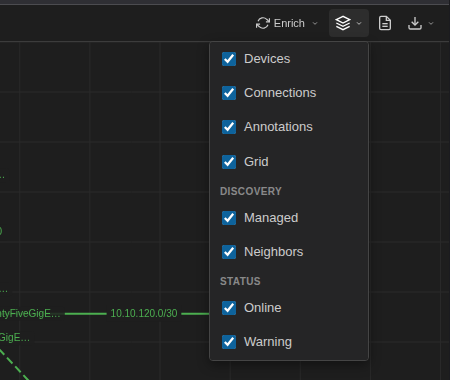
| Layers | Show or hide parts of the diagram. |
| Export snapshot to Docs | Save the topology into Documents. |
| Export | Export as PNG, SVG or JSON. |
Devices and Links
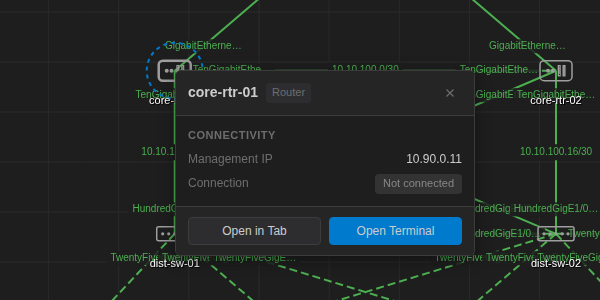
Click a device to open its detail card with the management IP and connection state, plus Open in Tab (a full device detail tab with system information, SNMP data, interfaces and history) and Open Terminal.
Right-click a device for more actions:
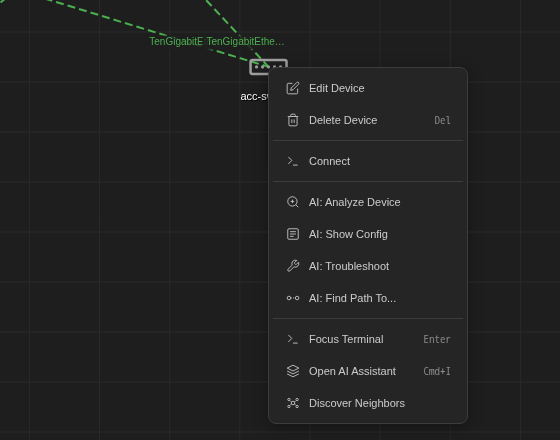
- Edit Device, Delete Device, Connect, Focus Terminal.
- AI: Analyze Device, AI: Show Config, AI: Troubleshoot, AI: Find Path To..., Open AI Assistant — hand the device to the AI assistant with the topology as context.
- Discover Neighbors asks the AI assistant to find the device's neighbours; in standalone mode Add to Discovery adds it to a discovery run.
Right-click a link for Ask AI about this link, Ask AI: why is this link erroring? and Delete link. Clicking a link opens its detail card, with traffic data when live polling is on.
Auto-layout and Layers
Auto-layout re-arranges the devices with one of four algorithms. Hierarchical works well for core/distribution/access designs; Force-Directed for meshes.
Layers toggles Devices, Connections, Annotations and Grid, discovered Managed and Neighbors devices, and devices by status.
3D View
Click 3D in the toolbar to see the same topology in 3D, with device labels, interface names and animated traffic particles along the links. Drag to rotate, scroll to zoom and right-drag to pan. The buttons at the top right switch between orbit mode and fly mode (WASD to move, mouse to look).
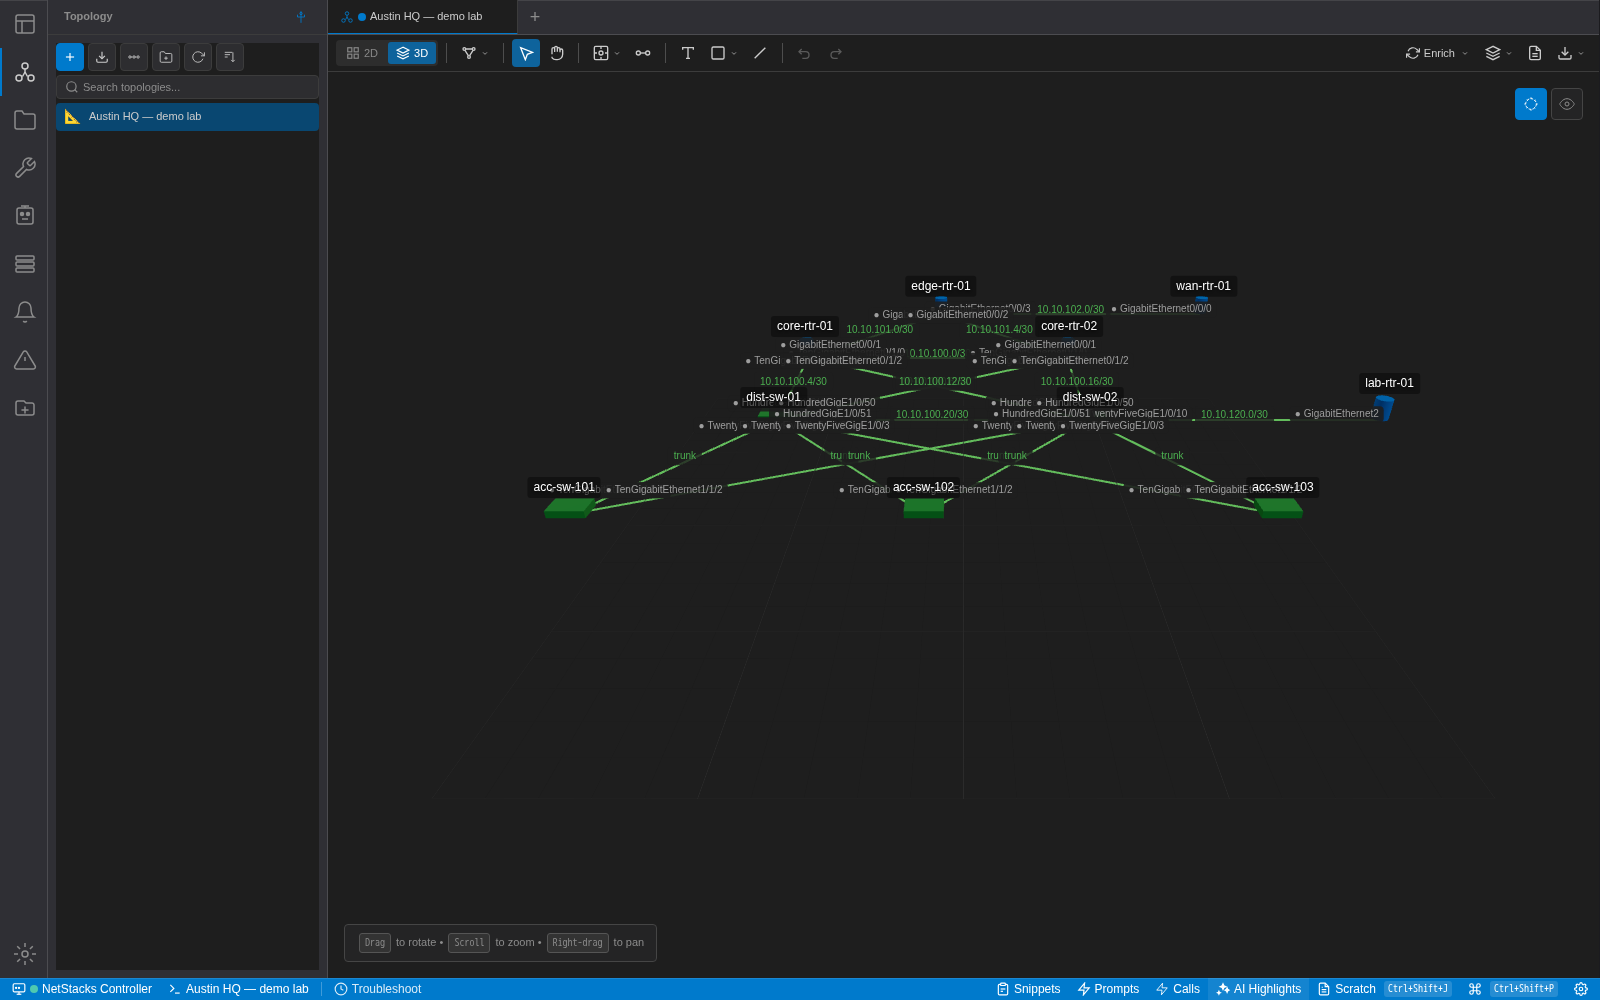
The 3D view is available only in the Terminal, not in the admin console.
Enrich
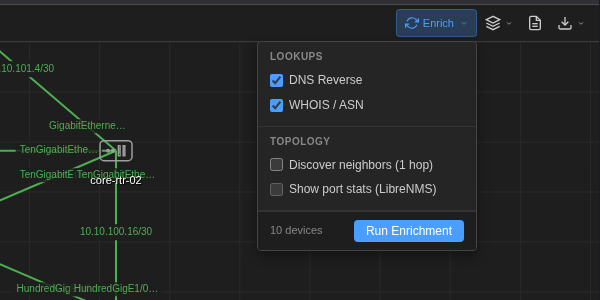
Enrich looks up extra information for every device on the topology. Choose what to run and click Run Enrichment:
- Lookups: DNS Reverse, WHOIS / ASN.
- Topology: Discover neighbors (1 hop) adds neighbouring devices; Show port stats (LibreNMS) shows port statistics from a LibreNMS source.
- Configured integrations and MCP tools can appear as additional sources.
Live SNMP Overlay
In the standalone Terminal, the Live button (“Start live SNMP polling”) polls the devices on the topology every 30 seconds over SNMP v2c and overlays the results:
- Links are coloured by health (green, orange, red, or grey when unknown) based on errors, discards and utilisation; busier links are drawn thicker, unhealthy ones pulse, and the midpoint shows Util: N%.
- Each device shows a pill with interfaces up (N/M Up), CPU and memory, plus an uptime badge.
The button appears when the topology's devices have IP addresses, their profiles have SNMP community strings, and links have interface names (as discovery produces). Click it again to stop polling. See SNMP Polling.
Visualize a Traceroute
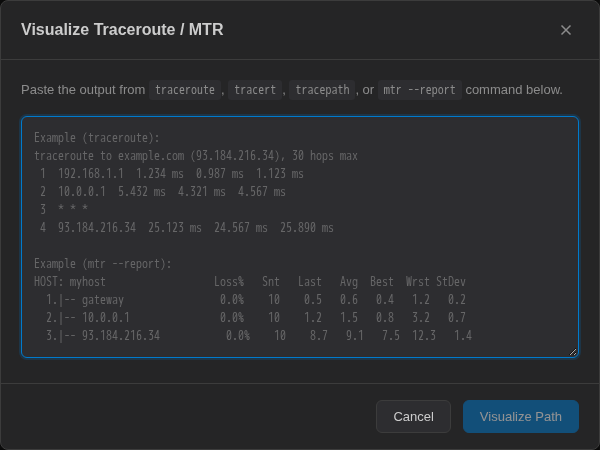
Click Paste Traceroute / MTR, paste the output of traceroute, tracert, tracepath or mtr --report, and click Visualize Path. You can also right-click traceroute output in a terminal to visualize it directly. The path opens as an unsaved topology; save it with Save topology to database.
Export and Share
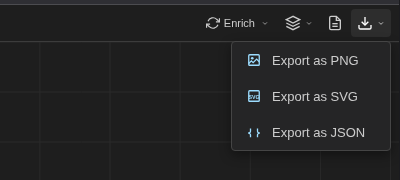
Export saves the topology as PNG, SVG or JSON (JSON can be imported again). Export snapshot to Docs stores a copy in Documents. In enterprise mode, Publish to Team in the sidebar shares the topology with your organization.
Topologies in the Admin Console Enterprise
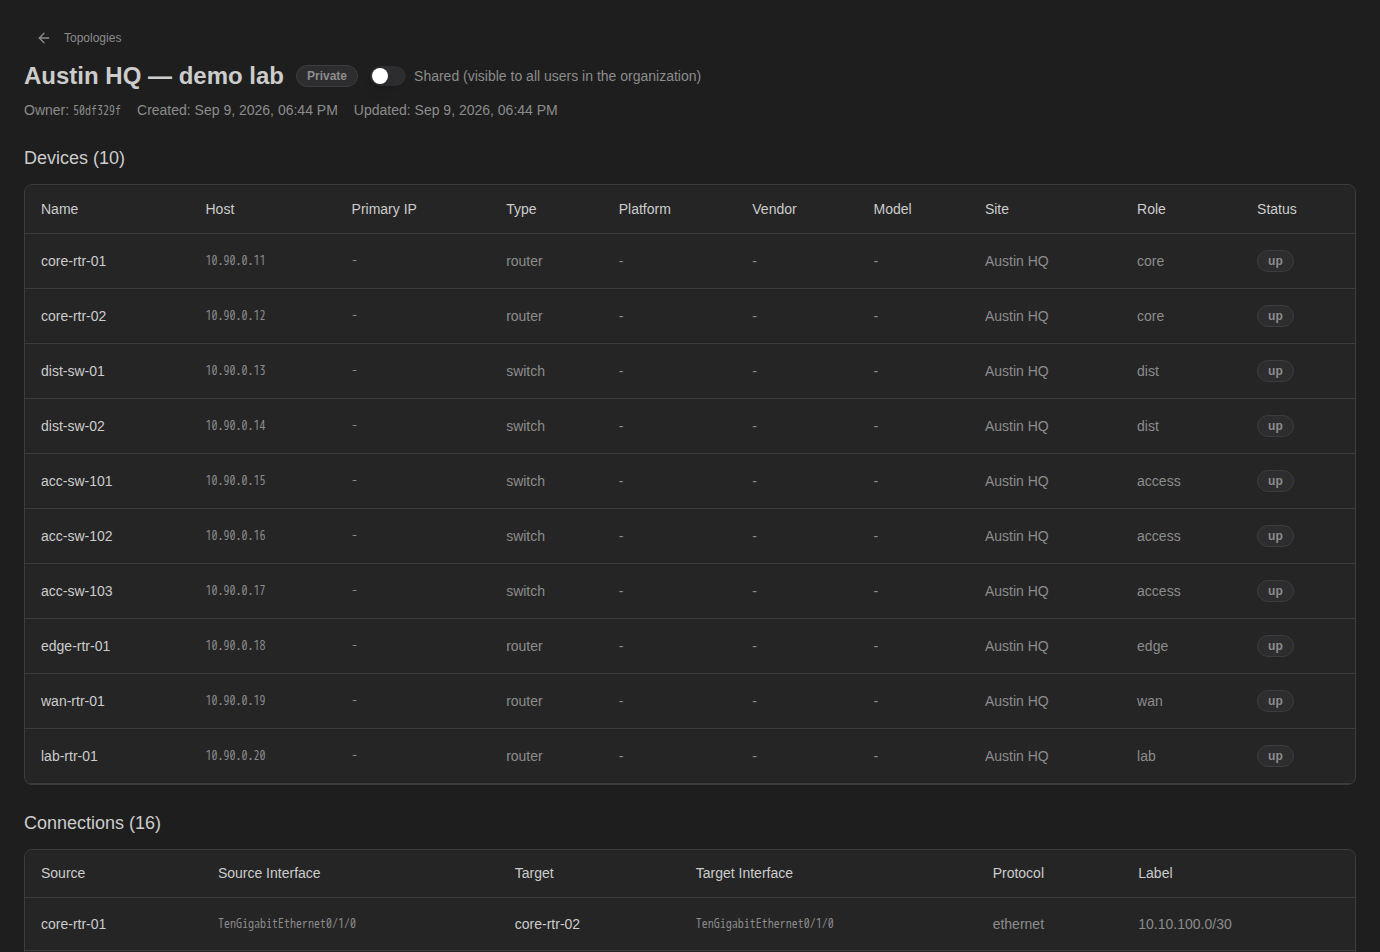
Inventory → Topologies lists every topology saved on the Controller with its Owner, number of Devices and Connections, Shared state and Last Updated time. Discover runs neighbour discovery from the Controller (see Network Discovery), and the trash icon deletes a topology.
Click a topology to see its devices (name, host, type, site, role, status) and connections (source and target interfaces, protocol, label) as tables, and to toggle Shared (visible to all users in the organization). Drawing and editing happen in the Terminal.
Discovery Maps Enterprise
The NetStacks Crawler offers a separate, lightweight mapping tool in the admin console. On a device's detail page, expand Topology, click Start mapping here, and use the + on a device to add its discovered neighbours one by one. Open full map opens the map on Discovery → Topology, which lists Saved maps and Recent explorations. You can also start a map from the Traceroute Resolver.
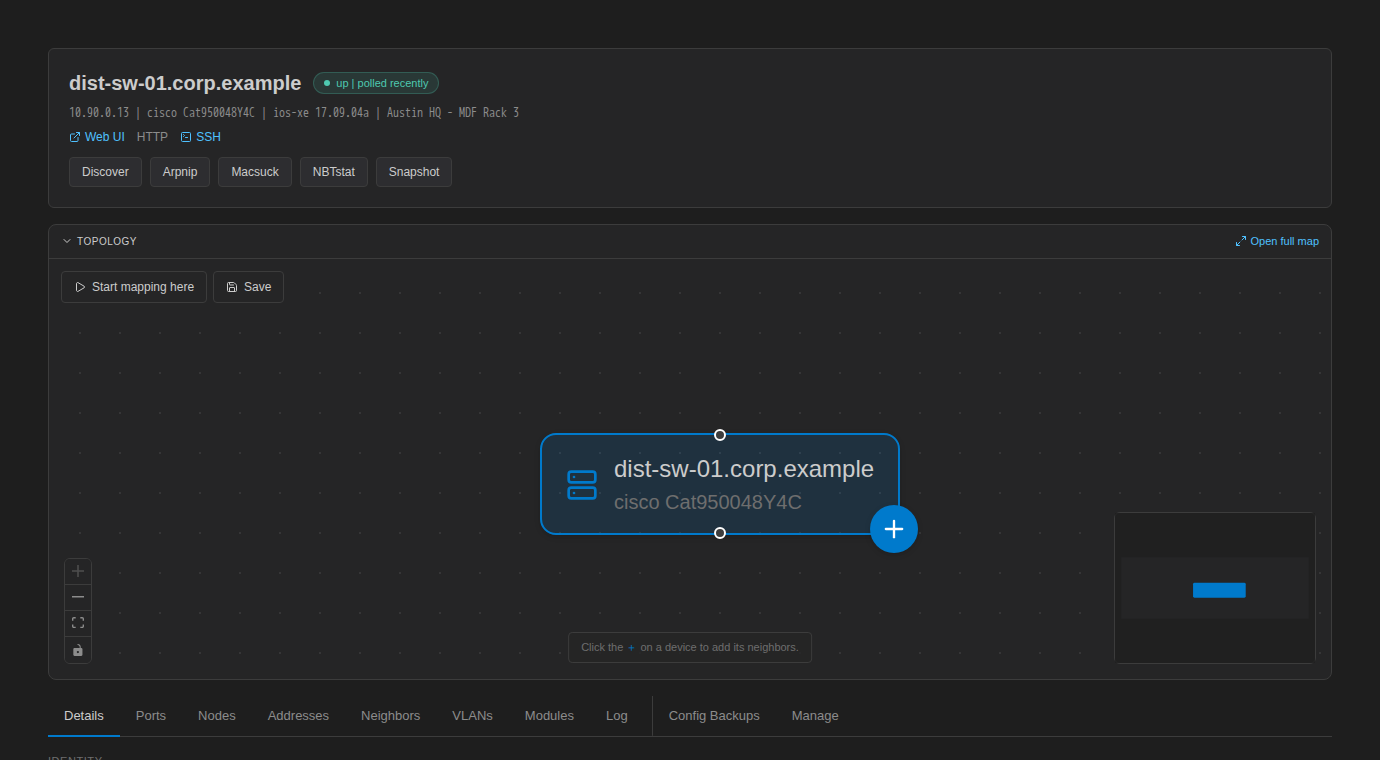
Discovery maps are saved in your browser, so they are not shared with other users. For a shared diagram, build the topology in the Terminal and publish it to your team.