Run History & Monitoring
Where to find the results of NetStacks automation: MOP executions in the Terminal and admin console, scheduled task runs, and the Controller's Activity Monitor.
Overview
Every automation run in NetStacks leaves a record. This table shows where to look:
| What ran | Standalone Terminal | With a Controller |
|---|---|---|
| A MOP | The MOP's Execute tab (Executions list) and Review tab | The MOP's History tab in the Terminal, the MOP page in the admin console, and the Activity Monitor |
| A scheduled task | — | The task's run history on the Scheduled Tasks page, and the Activity Monitor |
| Deployments, snapshots, scripts, AI agents, SSH sessions | — | The Activity Monitor |
MOP Executions
While a MOP runs, its Execute tab shows each device's steps with live status and output. Afterwards:
- The Review tab summarizes the run (devices, steps passed, failed and skipped) and can generate a MOP document. See The Review Tab.
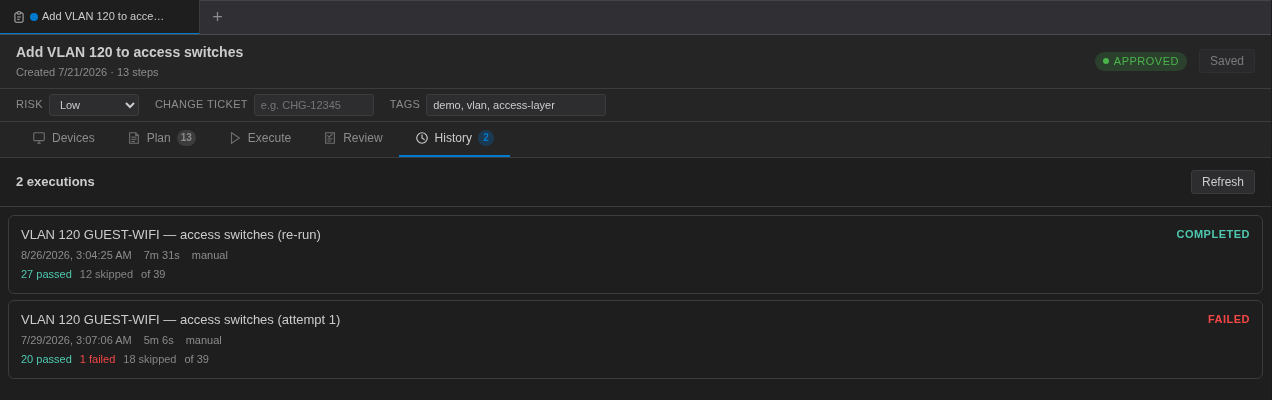
- With a Controller, the History tab lists every execution of the MOP with its status, start time, duration, control mode and step counts.
In the admin console, the MOP's page (Config Automation → MOPs, then the MOP) ends with Execution History. Expand a run to see its phase, timing, strategy and every device's steps with their status.
Scheduled Task Runs Enterprise
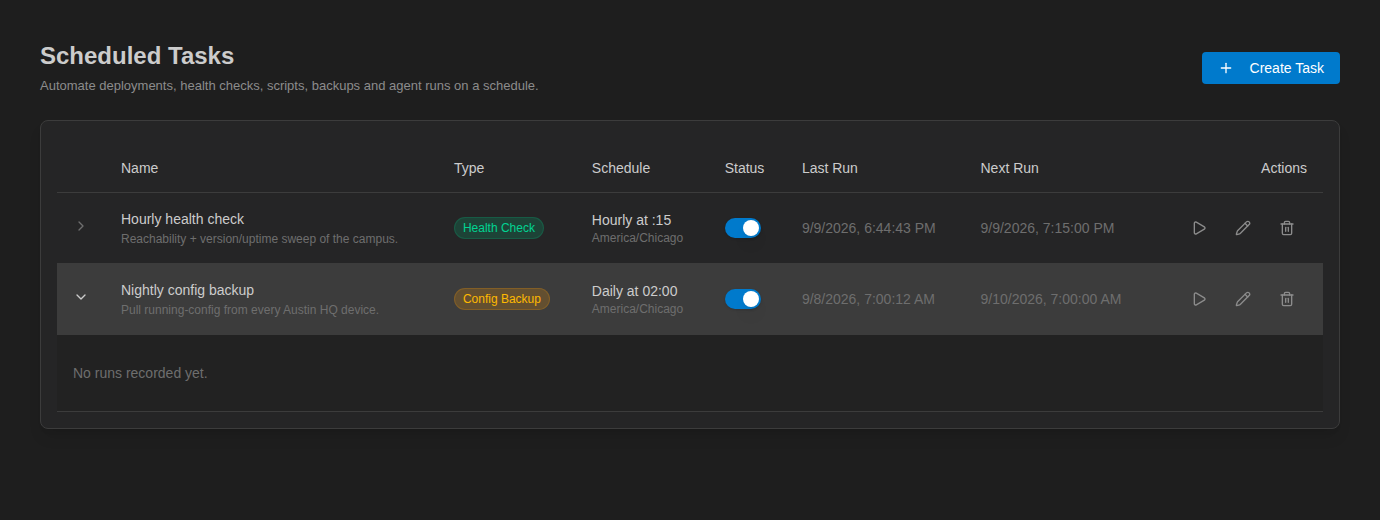
On Config Automation → Scheduled, click the chevron at the start of a task row to see its recent runs with status, start and end time and any error. The Last Run column shows when the task last ran.
Activity Monitor Enterprise
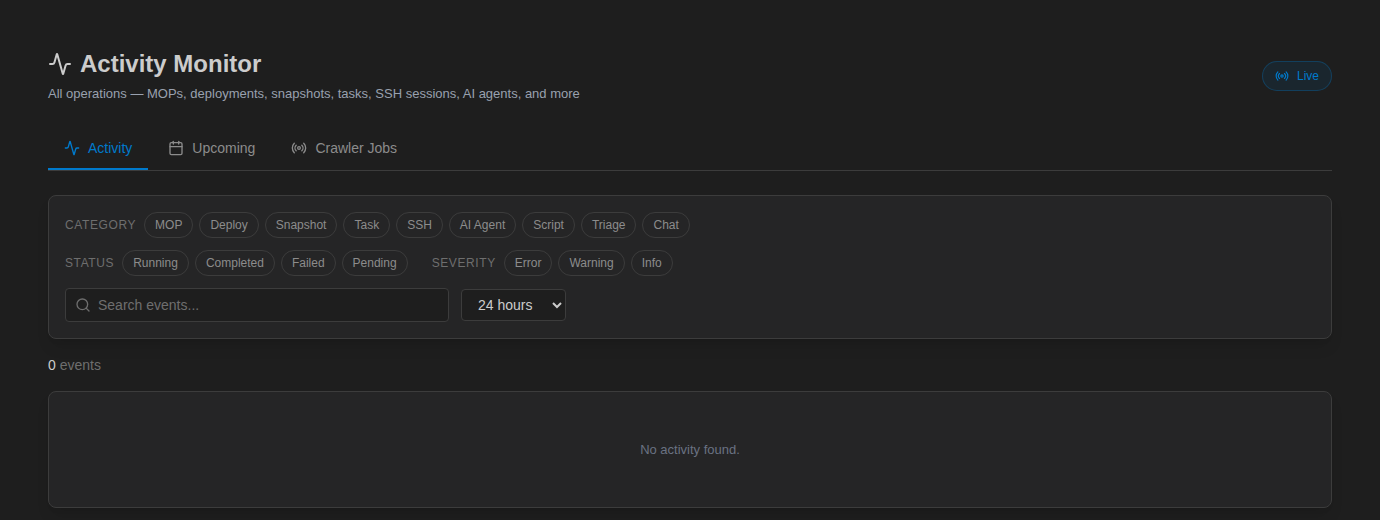
The Controller's Activity Monitor (sidebar Activity → Job History, /activity) collects operations from across the platform — MOPs, deployments, snapshots, tasks, SSH sessions, AI agents and more — in one place. Turn on Live to keep it updating. It has three tabs: Activity, Upcoming and Crawler Jobs. The full reference is on the Activity Monitor page.
Activity
A timeline of events with Time, Event, Status, User and Duration. Narrow it down with the filters:
- Category: MOP, Deploy, Snapshot, Task, SSH, AI Agent, Script, Triage, Chat
- Status: Running, Completed, Failed, Pending
- Severity: Error, Warning, Info
- Time range: Last hour, 6 hours, 24 hours, 7 days, 30 days
- A free-text search (Search events...)
Events link to their details, for example View per-device backups & transcripts for a snapshot or View per-device deployment logs for a deployment.
Upcoming
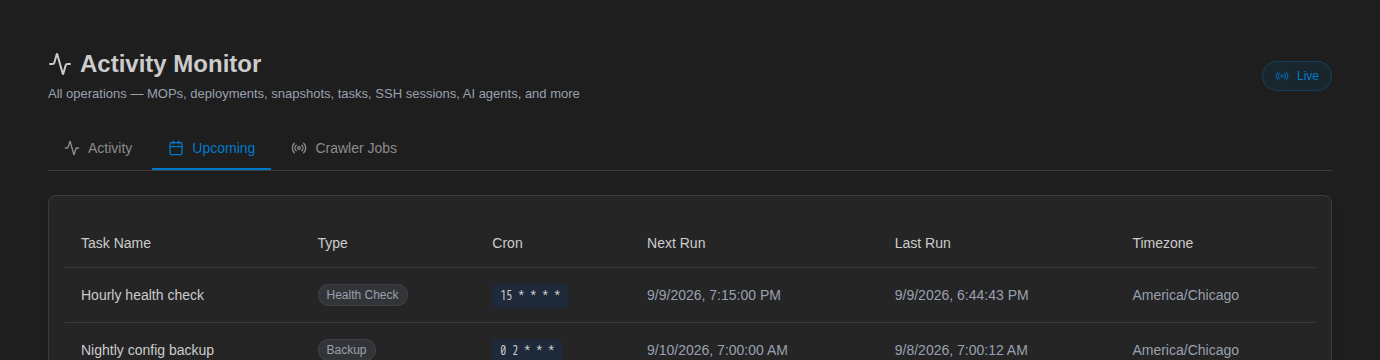
Lists enabled scheduled tasks with Task Name, Type, Cron, Next Run, Last Run and Timezone, ordered by their next calculated run time.
Crawler Jobs
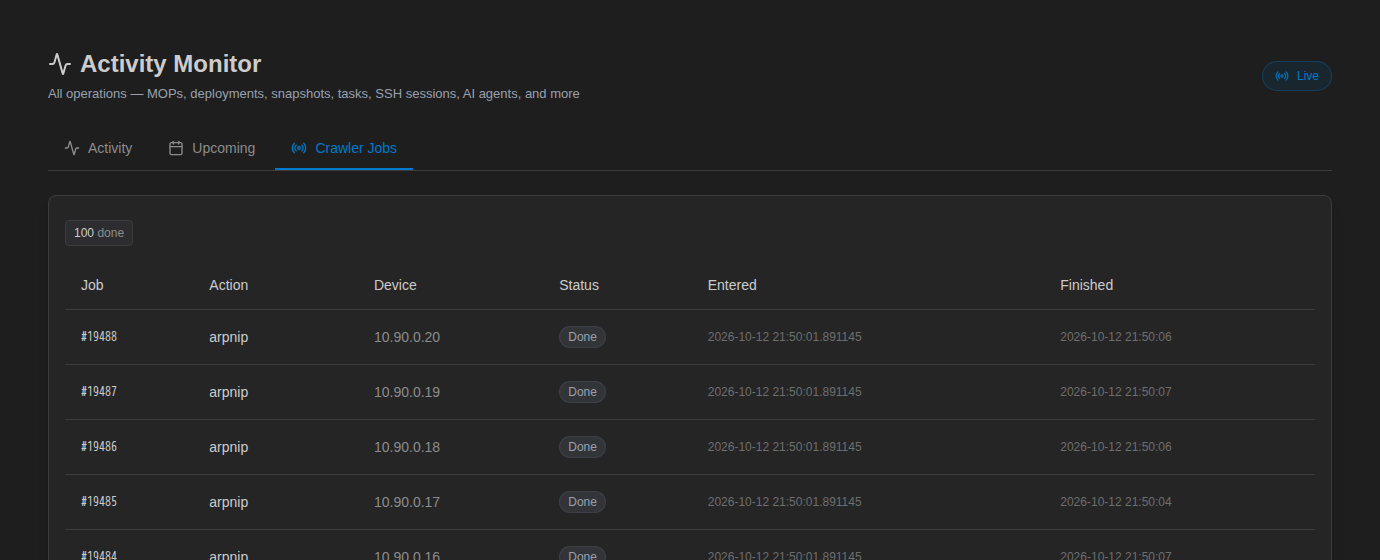
Shows the discovery crawler's job queue (discover, macsuck, arpnip and similar jobs) with Job, Action, Device, Status, Entered and Finished. Jobs appear once discovery runs.
See Network Discovery for how discovery is set up.
Audit Trail Enterprise
Each MOP step the Controller runs on a device is also recorded in the audit log, alongside sign-ins and configuration changes. See Audit Log.