Activity Monitor
EnterpriseFollow every operation on the NetStacks Controller in one place: MOP runs, deployments, config snapshots, scheduled tasks, SSH sessions, AI agents, scripts and discovery jobs.
Overview
The Activity Monitor is the Controller's job history. It merges events from nine sources — MOP executions, config deployments, config snapshots, scheduled task runs, SSH sessions, AI agent runs, device scripts, triage and AI chat — into a single timeline, so you can see what ran, who ran it, how long it took and whether it succeeded.
Open it from the sidebar Activity → Job History (/activity). It shows activity for the organization you are working in. For security events (sign-ins, user and role changes, secret reveals), use the Audit Log.
Activity Tab
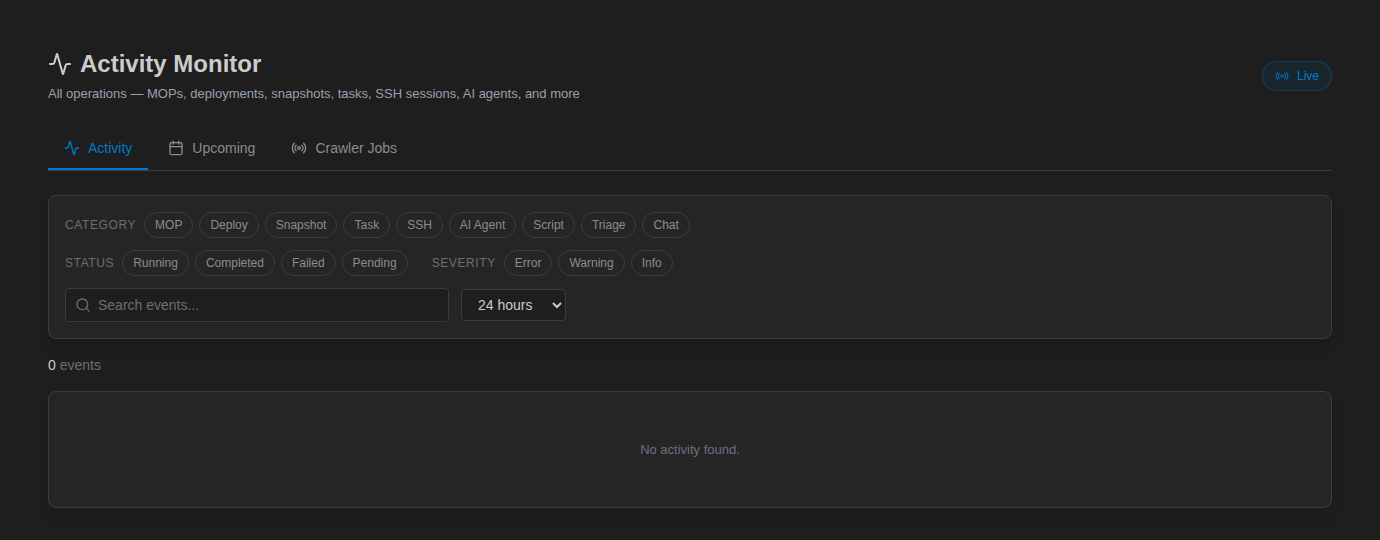
The page opens on the Activity tab showing the last 24 hours. Above the list, counters show the number of events, errors and running jobs. Each row shows the event type, user, duration and status. The Live button at the top right keeps the list refreshing automatically; click it to switch to Paused.
Filtering
| Filter | Options |
|---|---|
| Category | MOP, Deploy, Snapshot, Task, SSH, AI Agent, Script, Triage, Chat |
| Status | Running, Completed, Failed, Pending |
| Severity | Error, Warning, Info |
| Time range | Last hour, 6 hours, 24 hours, 7 days, 30 days |
| Search | Search events... matches event text |
Click the chips to toggle filters, and Clear to reset them.
Event Details and Drill-Down
Click a row to expand it. The detail view shows Category, Severity, Started, Completed and a Detail message (for failures, the error), plus a link to the full record where one exists:
- View per-device backups & transcripts — opens the config snapshot.
- View per-device deployment logs — opens the deployment in Config Deployments.
- View agent executions — opens AI agent execution history.
Upcoming Tab
Upcoming lists enabled scheduled tasks with Task Name, Type, Cron, Next Run, Last Run and Timezone. Tasks are created and edited on the Scheduled Tasks page.
Crawler Jobs Tab
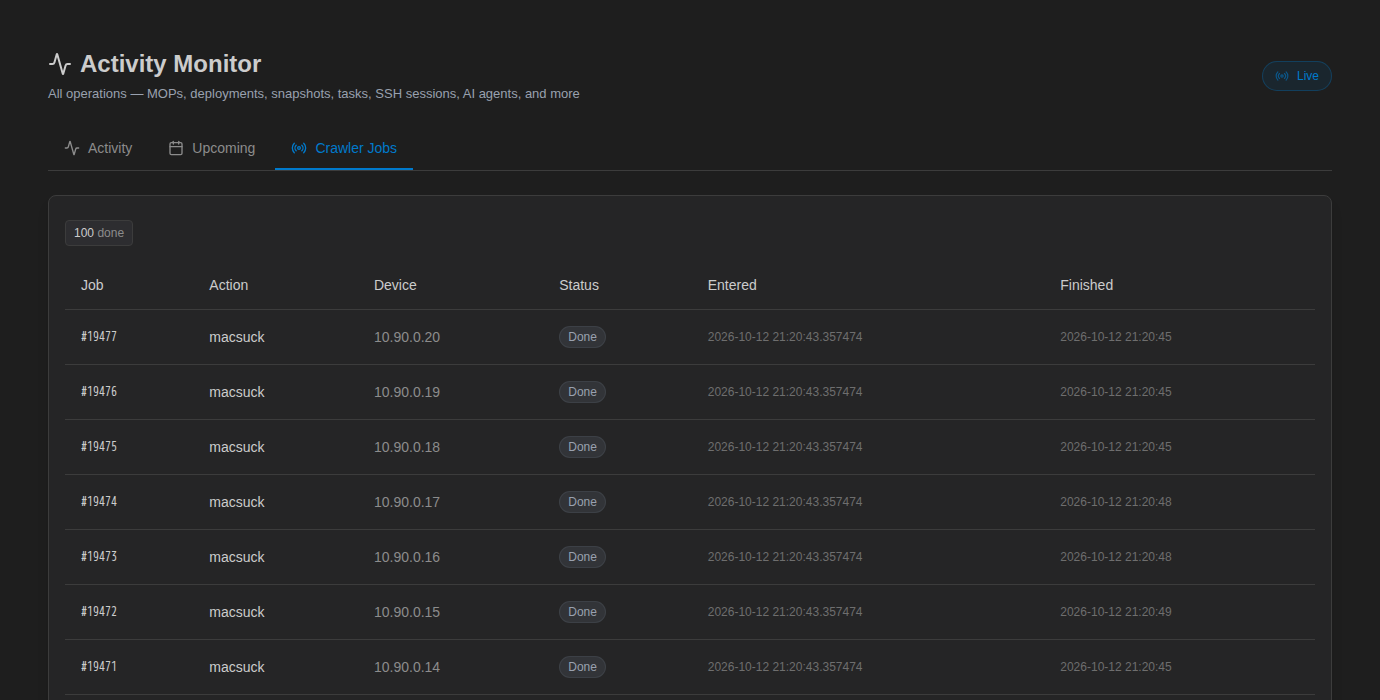
Crawler Jobs shows the integrated discovery engine's job queue: Job, Action, Device, Status, Entered and Finished. Jobs appear once discovery runs (see Discovery). If the crawler containers aren't running, the tab shows "Crawler not reachable" — check Platform Health.
Tips
- To review a maintenance window, select 7 days and the MOP and Deploy categories.
- To find failures quickly, filter on Failed status or Error severity.
- The dashboard's Recent Activity and Recent Jobs panels show the latest entries without leaving the home page.